Piktochart Graphic Design Tool Logo

Piktochart

Create visually stunning infographics, reports, and presentations in seconds.

Pricing: $29/mo.

Start for free.

Platform

Pricing

Launched

About Piktochart

Piktochart is an online graphic design tool that enables users to create visually appealing content such as infographics, presentations, reports, and social media graphics without requiring advanced design skills.

Key Features:

  • Drag-and-Drop Editor: User-friendly interface for easy customization of visual content.
  • Customizable Templates: A diverse selection of professionally designed templates for various content types.
  • Extensive Library of Design Elements: Access to icons, images, charts, and other design components.
  • Data Visualization Tools: Options to create charts and graphs for effective data representation.
  • Branding Consistency: Tools to maintain a uniform look across all designs for brand recognition.
  • Collaboration Features: Options for team collaboration on projects.
  • Map Maker: Ability to create customized maps for geographical data visualization.
  • AI Design Generator: Generates high-quality visuals instantly from text descriptions or documents, allowing users to create engaging visuals quickly and effortlessly.

Use Cases:

  • Annual Reports: Create engaging reports to showcase achievements and financial health.
  • Educational Infographics: Simplify complex concepts for better student understanding.
  • Marketing Materials: Design eye-catching social media graphics and promotional materials.
  • Presentations: Develop professional presentations that effectively communicate information.
  • Data Reporting: Visualize data trends in reports to enhance clarity and engagement.
  • Content Transformation: Convert text-heavy documents into engaging visuals with the AI design generator.

How Piktochart Works:

  1. Sign Up and Choose a Template: Users create an account and select from various templates based on their project needs.
  2. Customize Content: Using the drag-and-drop editor, users can add text, images, and design elements easily.
  3. Visualize Data: Users input their data into charts or graphs provided by the platform for clear representation.
  4. Utilize AI Features: Users can generate visuals from text prompts or documents using the AI design generator for quick results.
  5. Download or Share: Once completed, users can download their designs or share them directly through social media or other platforms.

Read More

Frequently Asked Questions

Piktochart is used for creating infographics, presentations, reports, and other visual content easily, making it accessible for users without advanced design skills.

Piktochart offers a free tier with limited features. For access to premium templates, advanced graphics, and collaboration tools, users can choose from various paid plans.

No, Piktochart is designed to be user-friendly, allowing anyone to create professional-looking visuals without prior design experience.

Yes, Piktochart includes collaboration features that allow multiple users to work on the same project in real time.

Yes, Piktochart offers a wide range of templates for various purposes, including marketing materials, educational resources, and business reports.

Follow Piktochart
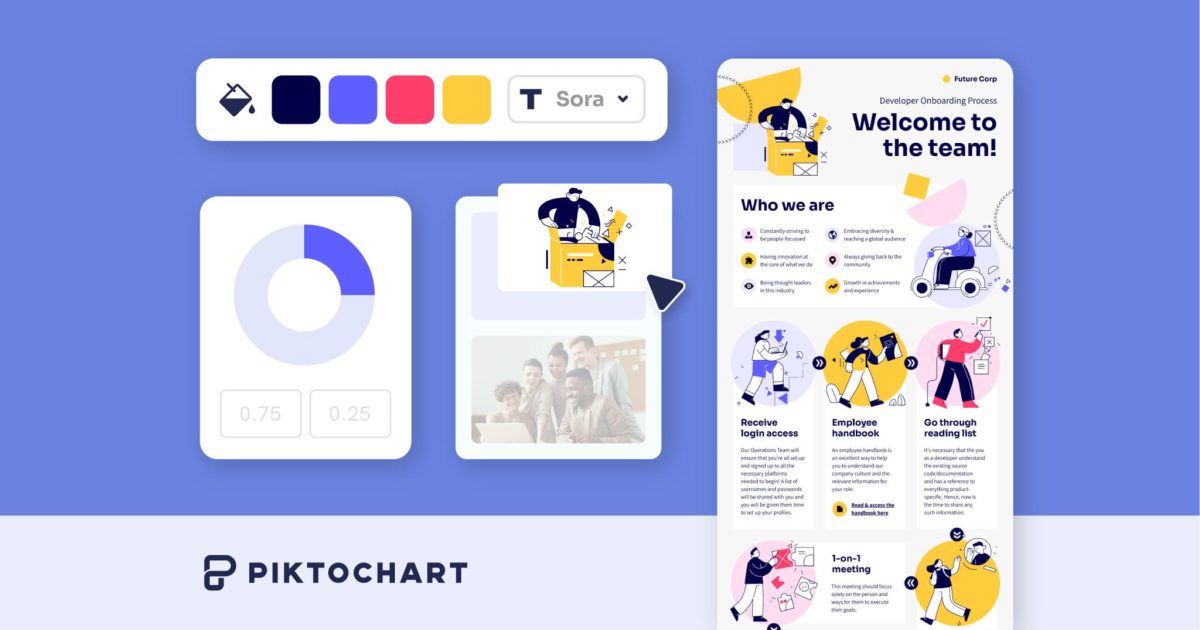
Piktochart Graphic Design Tool To Create Infographics, Presentations

Reviews

Low-effort reviews like “Great app, I love it” or “I didn’t like it” aren’t very helpful for users or app creators. Please tell us more about your experience.

Ratings

Great0%

Good0%

Decent0%

Bad0%

Terrible0%

Creator of Piktochart?
Claim it now.

Get access to this page:

  • Convert noFollow to doFollow.
  • Add/edit SEO-friendly title, tagline, and description to your liking.
  • Embed intro video.
  • Get notified on new reviews.
  • Respond to reviews, get access to daily in-depth analytics.
  • Change affiliate link to direct link.
  • Lifetime listing (doesn’t expire).